Definition: The load duration curve is defined as the curve between the load and time in which the ordinates representing the load, plotted in the order of decreasing magnitude, i.e., with the greatest load at the left, lesser loads towards the rights and the lowest loads at the time extreme right. The load duration curve is shown in the figure below.
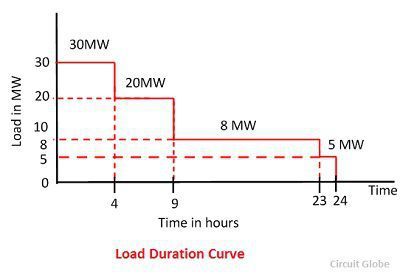
This curve represents the same data as that of the load curve. The load duration curve is constructed by selecting the maximum peak points and connecting them by a curve.The load duration curve plotting for 24 hours of a day is called the daily load duration curve. Similarly, the load duration curve plotted for a year is called the annual load curve.
Procedure for Plotting the Load Duration Curve
- From the data available from the load curve determines the maximum load and the duration for which it occurs.
- Now take the next load and the total time during which this and the previous load occurs.
- Plots the loads against the time during which it occurs.
The load duration curves can be drawn for any duration of time, for example, a day or a month or a year. The whole duration is taken as 100%.
Example: Consider the daily load curve data of the power system.
| Time | Load in MW |
|---|---|
| 6.00 am to 8.00am | 8 |
| 8.00 am to 1.00 noon | 20 |
| 1.00 noon to 2.00 noon | 5 |
| 12.30 noon to 6.00 pm | 30 |
| 6.00 pm to 6.00 am | 8 |
Solution: The data available from the load curve are tabulated as follows. Here the total time is 24 hours or 100%.
| Load in MW | Hours in a day | Time in percentage |
|---|---|---|
| 30 | 4 | 4/5×100=16.67% |
| 20 | 4+5 | 9/24×100=37.5% |
| 8 | 2+4+5+12 =23 | 23/24×100=95.83% |
| 5 | 4+5+2+12+1 = 24 | 24/24×100=100% |
Information Available Form Load Duration Curve
- The load duration curve gives the minimum load present throughout the specified period.
- It authorises the selection of base load and peak load power plants.
- Any point on the load duration curve represents the total duration in hours for the corresponding load and all loads of greater values.
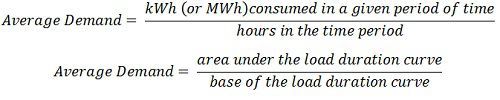
- The area under the load duration curve represents the energy associated with the load duration curve.
- The average demand during some specified time periods such as a day or a month can be obtained from the load duration curve.
Also See: Load Curve