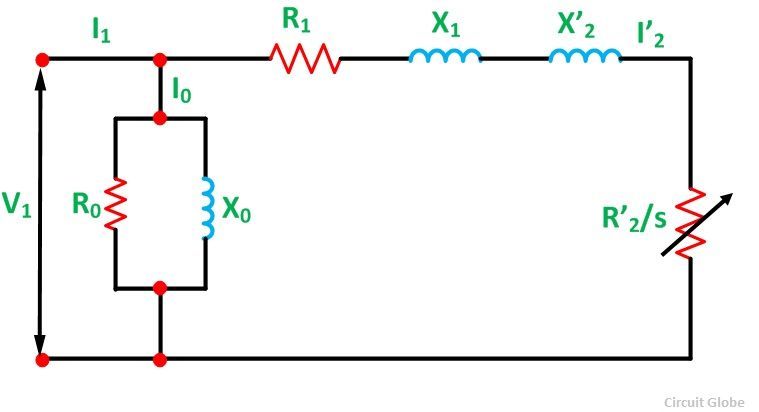
The Circle Diagram of an Induction motor is very useful to study its performance under all operating conditions. The construction of the circle diagram is based on the approximate equivalent circuit shown below. It is the diagrammatic representation of the performance of the induction motor. The circle diagram provides information about the power output, losses, and the efficiency of the induction motor.
Contents:
- Construction of the Circle Diagram
- Result Obtained from the Circle Diagram
- Significance of lines on the Circle Diagram
Applying KCL (Kirchhoff’s Current Law)![]()
Let the phase voltage V1 be taken along the vertical axis OY as shown in the figure below:
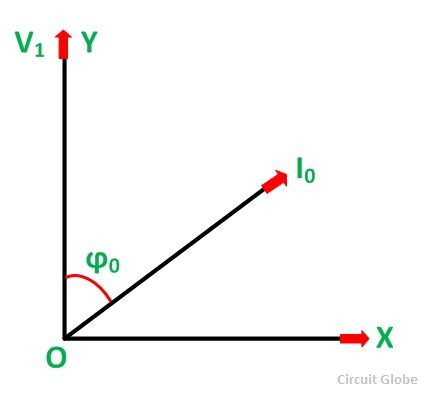
The No-Load current I0 = OA lags behind V1 by an angle ϕ0. The no-load power factor angle ϕ0 is of the order of 60 to 80 degrees because of the large magnetizing current needed to produce the required flux pole in a magnetic circuit containing the air gaps.
At the no-load condition, s = 0 and R2/s are infinite, or we can say that the R2/s is an open circuit at no load.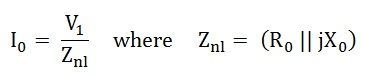
Here, all the rotational losses are considered under R0 and the no-load loss is given by the equation shown below:![]()
The rotor current referred to the stator is given by: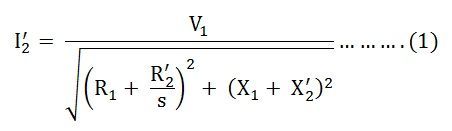
The current I’2 lags behind the voltage V1 by the impedance angle ϕ as shown in the figure below:
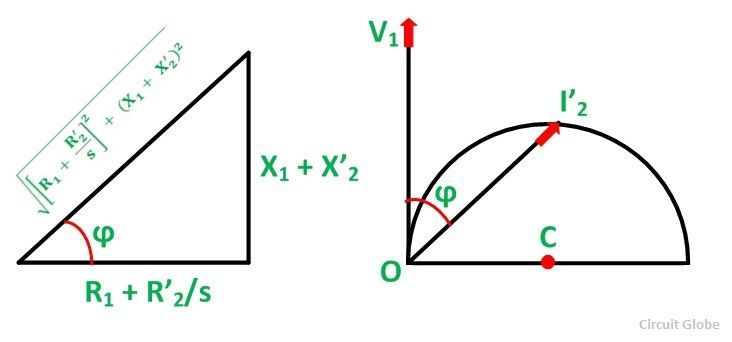
Where,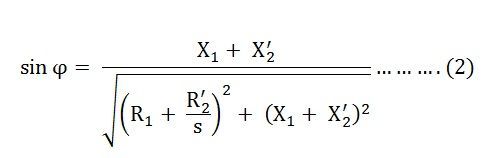
Combining equation (1) and (2) we get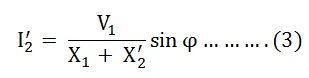
The above equation (3) is of the form r = a sin φ which represents a circle in polar form with the diameter a.
From the above figure (b) shown, the following points are illustrated.
- The locus of I’2 is a circle of the diameter V1/ X1 + X’2
- The radius of the circle O’C = V1/ 2(X1 + X’2)
- The center C has the coordinates [V1/ 2(X1 + X’2), 0]
The resulting circle diagram of the induction motor is shown below:
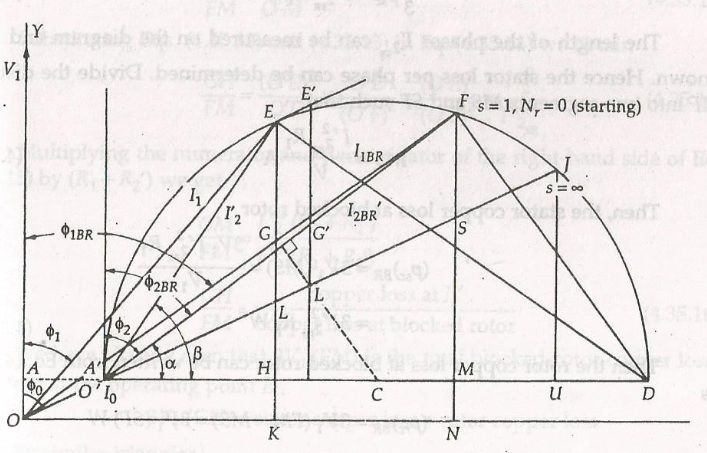
It is seen that the tip of the phasor I1 coincides with that of the phasor I’2. Thus, the locus of both I1 and I’2 is the upper semicircle. I1 and I’2 radiate from the origin O and O’ respectively. When the motor is started s = 1 with the rated voltage, the tip of I1 and I’2 will be at some point F of the circle.
As the motor accelerates, the tips of I1 and I’2 move around the circle in an anti-clockwise direction. This process continues until the output torque matches the load torque. If there is no shaft load, the motor accelerates to synchronous speed. At this point I’2 = 0 and I1 = 0.
Construction of the Circle Diagram
The following data are required for constructing the circle diagram:
- Stator phase voltage V1 = VL/√3
- No-load current I0
- No-load power factor cosϕ0
- Blocked rotor current and power factor
- Stator phase resistance R1.
Steps to draw Circle Diagram of an Induction Motor:
- Take the phasor voltage V1 along the y-axis.
- Choose a convenient current. With O as origin, draw a line OO’ = I0 at an angle ϕ0 with V1.
- Draw the line OKN perpendicular to V1. Similarly, draw a line O’D perpendicular to V1.
- From point O draw the line equal to the blocked rotor current I1BR to the same scale as I0. This line lags behind V1 by the blocked rotor power factor angle ϕ1BR.
- Join O’F and measure its magnitude in amperes. The line O’F represents I’2BR.
- From point F, draw a line FMN parallel to V1. This line is perpendicular to O’D and ON.
- Calculate MS = I’22BRR1/V1 and locate point S. Join O’S and extends it to meet the circle at J.
- Draw the perpendicular bisector of the chord O’F. This bisector will pass through the center of the circle at point C. Now with the radius CD’ or CD draw the circle.
Result Obtained from the Circle Diagram
Assume that the line current I1 is known. With the centre at O, draw an arc with the radius I1. This arc intersects the circle at the operating point E. Draw the line EK and locates the point H, L, G.
The following results are obtained from the circle diagram shown above.
- Input power = 3V1 KE
- Rotational losses = 3V1 KH
- Stator copper loss = 3V1 HL
- Rotor copper loss = 3V1 LG
- Output power = 3V1 GE
- Output torque = 3V1 LE/ωs
- Starting torque = 3V1 SF/ωs
- Slip = LG/LE
- Speed = GE/LE X ns
- Efficiency = GE/KE
- Power factor = KE/OE
Significance of lines on the Circle Diagram
Input line ON
The vertical distance between any point on the circle and the line ON represents the input power. Therefore, line ON is called the input line.
Output Line O’F
The vertical distance between any point on the circle and the line O’G represents the output power. Hence, line O’F is called the output line.
Air Gap Power Line O’J
Line EL represents the air gap power Pg; line O’L is referred to as the air gap power line. Since, Ʈd = Pg/ ωs. This line is also known as Torque line.