V curve is a plot of the stator current versus field current for different constant loads. The Graph plotted between the armature current Ia and field current If at no load the curve is obtained known as V Curve. Since the shape of these curves is similar to the letter “V”, thus they are called the V curve of a synchronous motor.
The power factor of the synchronous motor can be controlled by varying the field current If. As we know that the armature current Ia changes with the change in the field current If. Let us assume that the motor is running at NO load. If the field current is increased from this small value, the armature current Ia decreases until the armature current becomes minimum. At this minimum point, the motor is operating at a unity power factor. The motor operates at a lagging power factor until it reaches up to this point of operation.
If now, the field current is increased further, the armature current increases and the motor starts operating as a leading power factor. The graph drawn between armature current and field current is known as the V curve. If this procedure is repeated for various increased loads, a family of curves is obtained.
The V curves of a synchronous motor are shown below: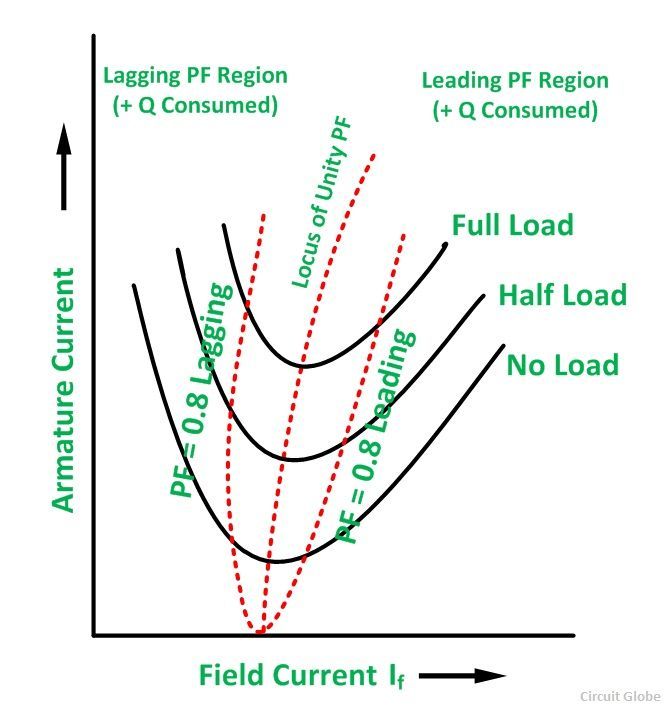 The point at which the unity power factor occurs is at the point where the armature current is minimum. The curve connecting the lowest points of all the V curves for various power levels is called the Unity Power Factor Compounding Curve. The compounding curves for 0.8 power factor lagging and 0.8 power factor leading are shown in the figure above by a red dotted line.
The loci of constant power factor points on the V curves are called Compounding Curves. It shows the manner in which the field current should be varied in order to maintain a constant power factor under changing load. Points on the right and left of the unity power factor corresponds to the over-excitation and leading current and under excitation and lagging current respectively.
The V curves are useful in adjusting the field current. Increasing the field current, If beyond the level for minimum armature current results in leading power factor. Similarly decreasing the field current below the minimum armature current results in a lagging power factor. It is seen that the field current for the unity power factor at full load is more than the field current for unity power factor at no load.
The figure below shows the graph between power factor and field current at the different loads.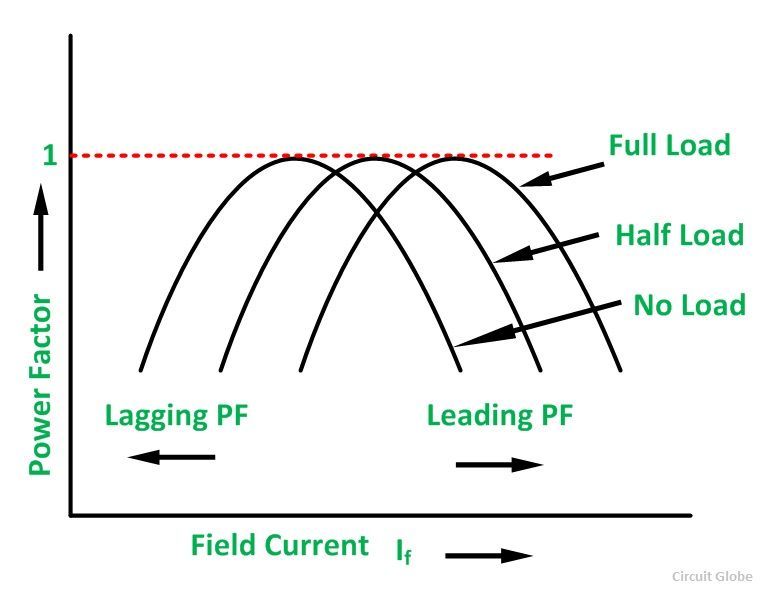
It is clear from the above figure that, if the synchronous motor at full load is operating at unity power factor, then removal of the shaft load causes the motor to operate at a leading power factor.
thanks
Awesome answers.
this answer is just awesome,thanks for this content.