The Capability Curve of a Synchronous Generator defines a boundary within which the machine can operate safely. It is also known as Operating Charts or Capability Charts. The permissible region of operation is restricted to the following points given below:
- The MVA loading should not exceed the generator rating. This limit is determined by the armature of the stator heating by the armature current.
- The MW loading should not exceed the rating of the prime mover.
- The field current should not be allowed to exceed a specified value determined by the heating of the field.
- For steady-state or stable operation, the load angle δ must be less than 90 degrees. The theoretical stability limit of the stable condition occurs when δ = 90⁰.
The capability curve is based upon the phasor diagram of the synchronous machine. The phasor diagram of a cylindrical rotor alternator at lagging power factor is shown below:
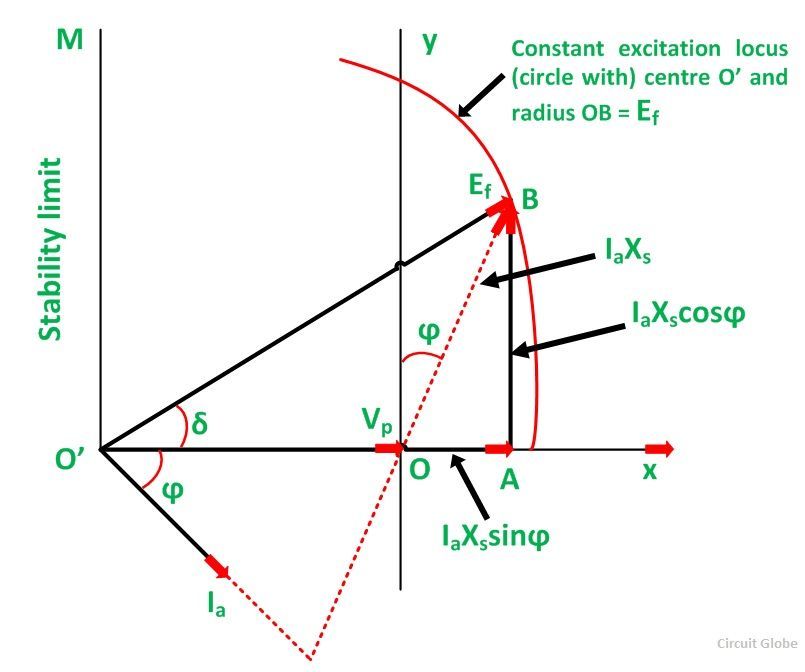
For simplicity, the armature resistance and saturation are assumed to be negligible. The machine is assumed to be connected to constant voltage busbars so that the voltage Vp is constant. The length O’O (= Vp) is fixed. The axes Ox and Oy are drawn with their origin O at the tip of Vp.
From the phasor diagram,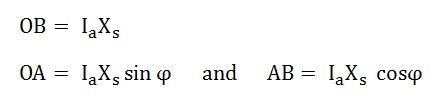
The real power output of the generator is given as:![]()
The reactive power output of the generator is given as:![]()
A typical capability curve for a cylindrical rotor generator is shown below:
The curve is plotted on the S-plane, where P is the vertical axis and Q is the horizontal axis. For constant power Ia and volt-amperes S = VA, the locus is a circle with a center at O and radius OB (= 3 Vp Ia). Constant P operation lies on a line parallel to Q axis. The constant excitation locus is a circle with center O’ and radius O’B ( = 3 Vp Ef/Xs). Constant power factor lines are straight radial lines from O.
For excitation Ef equal to zero, the armature current is given as:
= short circuit current at rated voltage
= OO’
The theoretical stability limit is a straight line O’M at right angles to O’O at O’. Here δ = 90⁰. Between a and b, the operation of the alternator is limited by the maximum field current, and a circle of radius (3 V Ef/ Xs) with center O’. Between b and c, the operation is limited by the MVA limit. Here Ia is the maximum permissible armature current. Between c and d, the operation is limited by the power of the prime mover. Between d and e, the operation is limited by the practical stability limit.
The theoretical limit of stability occurs where δ = 90⁰. But there must be a safety margin between the theoretical limit and that used in practice. The practical limit is usually taken 10% less than the theoretical stability limit. The complete operating zone of the alternator is abcdkOa. The operation of the alternator within this area is safe from the standpoints of heating and stability. Once an operating point is located within this area, the desired power P, S, Q i.e., Current, power factor, and excitation are found.
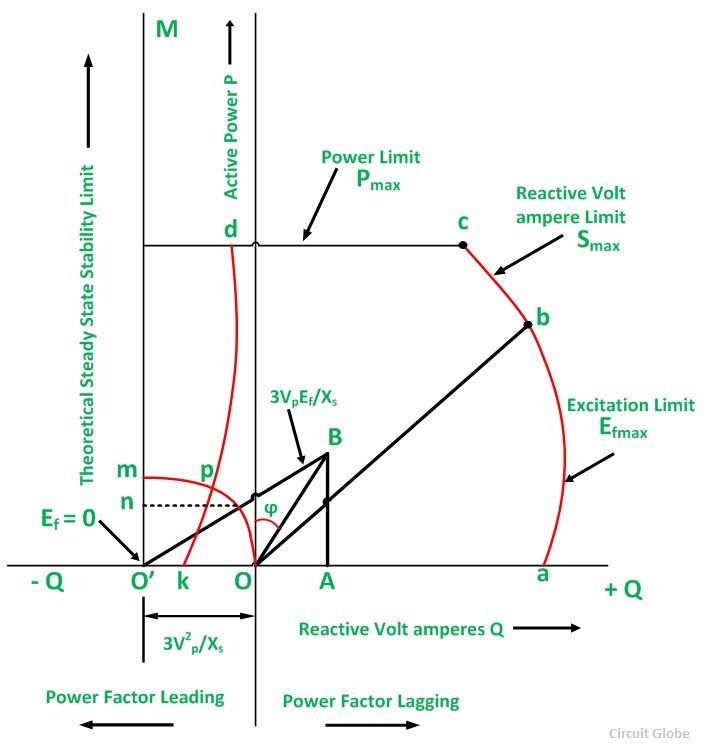
Consider the figure given below.
 Here an operating point F is considered, and the following information is given:
- If point F is inside the capability curve, the machine will not be overheated and will not be likely to fall out of synchronism.
- A line from F to the origin O’ of the If is at an angle δ from the axis.
- A line FG through F parallel to O’Oa give power equal to OG.
- A line from F to the origin O of the Q axis gives the power factor angle ϕ from the vertical axis. i.e., ∠FOG = ϕ
- The armature current Ia is given by OF.
- The VA output is given by (OF x operating voltage)
- The VAr output is given by GF x output voltage
- O’F gives the excitation Ef.
This is all about capability curve.
So nice and easy to learn about capability curve of the generator in this topic
Nicely explained.
I just wanted to remind myself
So great and simply explained
My best wishes to the author
Vk veluchamy
Excellent explanation. It was really helpful for me